The Data Processing Window
This panel allows the user (1) to select various processing parameters and options and (2) to process and visualize the resulting NMR spectra.
Here is a detailed description of all features of the 2D-Data Processing Window. Click here to
see specific details of the 3D-Data Processing Window.
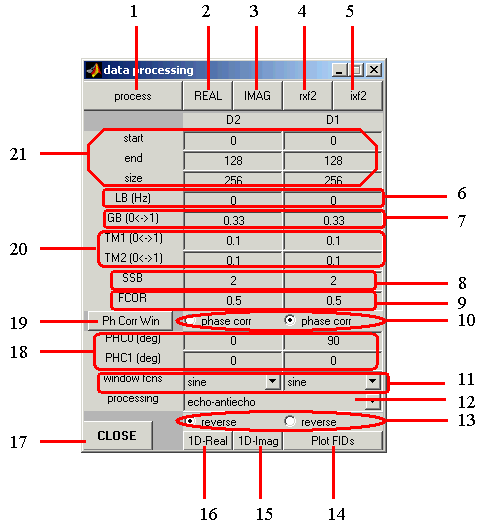
- Start Processing button: Click to process data,
after all processing params are set (see (6-13) and (18-21) below).
This is similar to the xfb command in XWINNMR.
- Real Part of the Spectrum: Click to display the real part of the calculated spectrum in the
Spectrum Display Window.
- Imaginary Part of the Spectrum: Click to display the imaginary part of the spectrum.
- Interferogram: Real Part. Click to display the real part of the interferogram resulting
from Fourier transformation in F2 (similar to xf2 in XWINNMR).
- Interferogram: Imaginary Part. Click to display the imaginary part of the interferogram resulting
from Fourier transformation in F2 (similar to xf2 in XWINNMR).
- Parameters for Lorentian Broadening: Define the linewidth (in Hz) for the Lorentian
broadening function.
- Parameters for Gaussian Broadening: Define the parameter (on the scale from 0 to 1) for the
Gaussian broadening function.
- SSB parameter: Define the SSB parameter controlling the shift in the sine-bell window function.
- FCOR parameter: Define a multiplication factor for the first point in FID in each dimension (default =0.5),
before Fourier transformaiton.
- Phase Correction radio buttons: Click on any of these buttons to include phase correction in the
corresponding dimension during processing.
- Window Function menus: Click and drag on these pull-down menus to select the type of the
window function for apodization in each dimension.
- Processing type menue: Click and drag on these pull-down menus to select the processing type for
frequency discrimination in t1.
- Reverse button: Check out these radio-buttons if you want the resulting spectrum to be reversed
(e.g. left-right or up-down flip) in the corresponding dimension.
- Plot FIDs button: Opens the FID Window and displays the Free Induction Decay (FID).
- 1D-Imag button: Opens the 1-D Window and displays the imaginary part of the 1D spectrum (1st row).
- 1D-Real button: Opens athe 1-D Window and displays the real part of the 1D spectrum (1st row).
- Close button: Closes the Data Processing window.
- Phase Correction parameters: Define the parameters for linear phase correction in each dimension.
Note: The phase correction will be applied only if the corresponding button in (10) is checked out.
- Phase Correction Window: Click on this button to open a window for manual phase correction. This
window helps determine parameters for linear phase correction.
- Parameters for Trapezoidal Window Function
- Data and Spectrum Size Define the starting and end points of the acquired data set to be
used for processing; define the size of the resulting spectrum. Zero-filling will be applied if
the desired spectum size exceeds that of the selected experimental data set (linear prediction
is currectly not included, this option has to be added).
Detailed description of the window functions and relevant processing parameters defined here can be found in Bruker XWINNMR manual.
Suggested sequence of events for data processing:
- Define all processing parameters and window functions;
- Click on the process button to process data and produce a spectrum;
- Click on one of the top buttons (REAL, IMAG, rxf2, or ixf2)
to display the desired part of the spectrum. This will open a Spectrum Display Window and
show the resulting spectrum as contour lines, with positive and negative contours colored red and blue,
respectively. The resulting spectrum can be zoomed in and out and also sliced in f1 and f2, using
buttons on the bottom of the Spectrum Display Window.
- If necessary, click on the Ph Corr Win to manualy determine parameters for linear phase correction;
- If necessary, change one or more processing parameters and repeat the steps 1-3 again.
- Close the window when finished.
BACK TO MAIN VNMR VINDOW
BACK TO VNMR MANUAL
Back to top
Page designed by David Fushman & Peter Nicholas. Last modified 01/31/2004.